I have typed htop thousands of times. On every laptop, every server, every Raspberry Pi in the house. It was the reflex: something feels slow, open htop, sort by CPU, kill the offender.
The problem is that htop only answers half the question. It tells me which process is busy. It does not tell me that the disk is pinned at 400 MB/s of writes, or that the NAS link is saturated, or that memory has been creeping up for ten minutes. For that I was opening iostat, iftop, and free in three other panes.
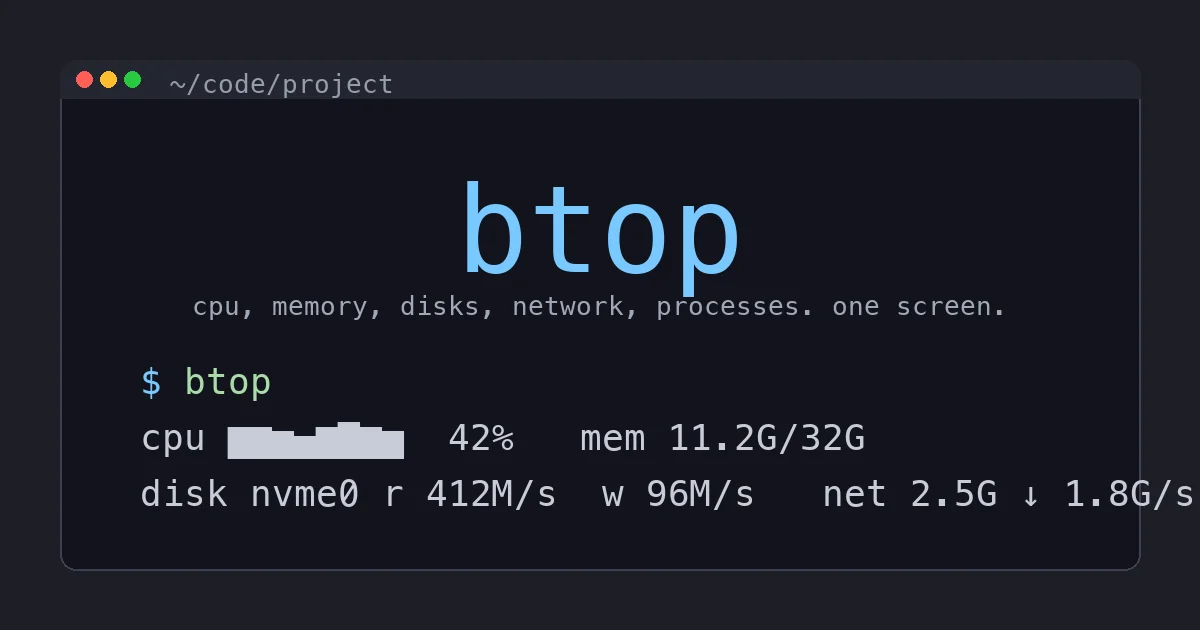
btop puts all of it on one screen. I switched about a year ago, and it is now the first thing I install on a new machine, right after my shell and zoxide. Here is what it does, how I configure it, and the one catch worth knowing before you go looking for GPU graphs.
What btop Actually Is
btop (sometimes written btop++) is a terminal resource monitor written in C++ by the same developer behind bashtop and bpytop. It is the third generation of that idea, rewritten for speed. It is free and open source under the Apache 2.0 license, it runs on Linux, macOS, FreeBSD, NetBSD, and OpenBSD, and it is in basically every package manager:
brew install btop          # macOS
sudo apt install btop      # Debian, Ubuntu
sudo dnf install btop      # Fedora
sudo pacman -S btop        # Arch
The current release line is 1.4.x. Run btop and you get four boxes by default: CPU, memory and disks, network, and processes. Each one is live, colored, and drawn with braille or block characters so the graphs have real resolution even in a modest terminal window.
The Four Boxes, and Why They Beat htop
CPU. A history graph for total usage across the top, per-core meters underneath, load averages, and CPU temperature when the sensor is available. The history graph is the part I did not know I wanted. With htop you see a snapshot. With btop you see that the spike started 40 seconds ago and has not dropped, which is a very different problem from a one-second blip.
Memory and disks. Used, available, cached, and free memory each get their own small graph, plus swap. Below that, every mounted disk shows used space and live read and write rates. This is the box that saves me the most time. When a build crawls on my laptop, half the time it is not CPU at all; it is something hammering the SSD. When Plex transcodes on the home server, I can watch the array disks light up. htop shows none of this.
Network. Upload and download graphs for the selected interface, with current rate, peak, and total transferred. Press b and n to cycle interfaces. On the NAS I keep it on the 2.5GbE link so I can see immediately whether a slow copy is the network or the disks. If you are building out a faster LAN, my 2.5GbE home network upgrade guide covers the hardware side; btop is how I verify it.
Processes. Everything htop’s list does: sort by any column, filter, tree view, send signals. Press f and type to filter, e to toggle tree view, arrow keys to move (or j and k once you turn on vim_keys), t to terminate, k to kill, and Enter to expand a process into a detail panel with its command line, threads, memory, and its own CPU graph. You can also click on everything. Mouse support sounds like a gimmick until you are on a laptop trackpad and just want to click the column you want to sort by.
Installing It Everywhere
The packaged version is fine on Linux distributions and Homebrew. Two notes from running it across a fleet of machines:
- Old LTS distributions ship old btop. Ubuntu’s package can lag well behind upstream. If a feature I mention here is missing, grab the static binary from the GitHub releases page instead.
- Over SSH it is still fast. btop redraws only what changed, so it is fine over a normal connection. On a really slow link, raise the update interval (more on that below) and it behaves.
I sync one config file across machines with my dotfiles, which brings me to the part most reviews skip.
The Config Tweaks Worth Making
btop writes its settings to ~/.config/btop/btop.conf. You can edit everything from the in-app menu (press m or Esc, then Options), and it saves the file for you. That file is plain key = value text, so it diffs cleanly in a dotfiles repo. These are the lines I change on every machine:
color_theme = "TTY"
theme_background = False
vim_keys = True
update_ms = 1500
proc_tree = True
proc_per_core = False
shown_boxes = "cpu mem net proc"
mem_graphs = True
show_disks = True
only_physical = True
net_auto = True
What each one does in practice:
theme_background = Falselets your terminal’s own background show through. It looks far better in a transparent or themed terminal like Ghostty and stops btop from fighting your color scheme.color_themepicks one of the bundled themes.TTYuses your terminal’s 16 colors, which means btop matches whatever palette you already like. Gruvbox, Nord, Dracula, and Tokyo Night are also built in.vim_keys = Trueenablesh,j,k,lnavigation. Kill moves to capitalKwhen this is on, which I prefer anyway; it is harder to fat-finger.update_ms = 1500speeds the refresh up from the 2000 ms default for snappier graphs on my laptop. On a tiny VM or a slow SSH link, go the other way to 3000 or more.proc_per_core = Falsereports process CPU as a share of the whole machine, so a process maxing one core on a 16-core box shows about 6 percent, not 100. Flip it if you prefer the htop convention. Just pick one and stay consistent across machines.only_physical = Truehides tmpfs, overlay, and snap mounts from the disk list. On a Docker host this is the difference between a readable disk box and forty lines of noise.
The other setting I lean on is presets. Press p to cycle through layouts, and define your own with the presets line in the config. I have one that shows only CPU and processes for small tmux panes, and one that shows only network and disks for watching a big file copy to the NAS. Switching takes one keypress.
The GPU Catch
This is where btop’s reputation gets ahead of the binary you actually download. btop supports GPU monitoring for NVIDIA, AMD, and, since 1.4.0, Intel GPUs. It is genuinely useful when you are running a local model or a Frigate detector on a GPU and want to see utilization next to CPU and memory.
But the prebuilt binaries on the GitHub releases page are built without GPU support. The release notes say so plainly: compile it yourself or use a distribution package built with it. GPU support relies on loading the vendor libraries at runtime, which a fully static build cannot do. Some distribution packages include it and some do not, so check before you assume. Intel support is also thin, with utilization, power, and clock speed only.
On my Linux box with an NVIDIA card, building from source took about two minutes with make GPU_SUPPORT=true and I got GPU utilization, VRAM, power, and temperature right in the CPU box. On my Mac I do not get a GPU panel at all. If GPU stats are the main reason you want btop, check your package first, or keep nvtop around for that job.
btop vs htop vs glances vs bottom
I still use the others, just less often.
| Tool | Best at | Where it loses |
|---|---|---|
| btop | One-screen overview with history for CPU, memory, disk, network | Heavier; GPU needs the right build |
| htop | Fast, tiny, already installed on most servers | No disk or network I/O, no history |
| glances | Web UI and an API you can scrape or feed into Home Assistant | Python, slower to start, cluttered TUI |
| bottom (btm) | Rust, very configurable, nice zoomable graphs | Smaller community, fewer themes |
My honest split: btop on any machine I own and log into regularly. htop when I SSH into something I do not control, because it is already there and I am not installing software on a client’s box to check a load spike. glances when I want metrics exposed over HTTP, since it has a built-in web server and REST API; that is how a couple of my home-lab machines report CPU and disk into Home Assistant. If you are monitoring a NAS or a mini PC that way, my best mini PC for Proxmox guide covers the hardware I run it on.
bottom is genuinely good and I would not argue with anyone who prefers it. I just find btop’s default layout more readable at a glance, and the theme support is better.
Where btop Falls Short
It is not perfect, and the pros list should not hide the friction.
It is busy. Four boxes of moving graphs is a lot of motion on screen. On a small terminal the default layout crams everything together. The fix is presets and turning off boxes you do not need, but out of the box it can feel like a dashboard someone left the demo mode on.
It costs more than htop. btop typically uses a bit more CPU and memory than htop while running. On a laptop or server that is noise. On a 512 MB VPS or a Pi Zero, it is not, and htop is the better guest.
It is an observer, not a historian. btop’s graphs cover the last few minutes. If you need to know what happened at 3 a.m., you need real monitoring like Netdata, Prometheus, or the history in Home Assistant. btop is for right now.
macOS gets a slightly thinner view. Temperatures and some disk stats depend on what the platform exposes. It still beats Activity Monitor for a quick look, but the Linux experience is the complete one.
The Bottom Line
btop is the best interactive system monitor in the terminal right now, and it is free. It replaced htop for me because it answers the full question, which part of the machine is slow and since when, instead of only which process is busy. Install it from your package manager, spend ten minutes on the config (transparent background, a theme that matches your terminal, only_physical disks, and a couple of presets), and sync that file to every machine you own.
The one thing to know going in is GPU support: the prebuilt release binaries do not have it, and Intel coverage is limited. If GPU graphs are why you came, check your distribution package or build from source. For everything else, CPU, memory, disks, network, and processes, I have not found anything better, and I have stopped looking.